37 stories
·
0 followers

DrP: Meta’s Root Cause Analysis Platform at Scale

1 Share

Incident investigation can be a daunting task in today’s digital landscape, where large-scale systems comprise numerous interconnected components and dependencies

DrP is a root cause analysis (RCA) platform, designed by Meta, to programmatically automate the investigation process, significantly reducing the mean time to resolve (MTTR) for incidents and alleviating on-call toil

Today, DrP is used by over 300 teams at Meta, running 50,000 analyses daily, and has been effective in reducing MTTR by 20-80% 

By understanding DrP and its capabilities, we can unlock new possibilities for efficient incident resolution and improved system reliability.

What It Is

DrP is an end-to-end platform that automates the investigation process for large-scale systems. It addresses the inefficiencies of manual investigations, which often rely on outdated playbooks and ad-hoc scripts. These traditional methods can lead to prolonged downtimes and increased on-call toil as engineers spend countless hours triaging and debugging incidents.

DrP offers a comprehensive solution by providing an expressive and flexible SDK to author investigation playbooks, known as analyzers. These analyzers are executed by a scalable backend system, which integrates seamlessly with mainstream workflows such as alerts and incident management tools. Additionally, DrP includes a post-processing system to automate actions based on investigation results, such as mitigation steps.

DrP’s key components include: 

  1. Expressive SDK: The DrP SDK allows engineers to codify investigation workflows into analyzers. It provides a rich set of helper libraries and machine learning (ML) algorithms for data access and problem isolation analysis, such as anomaly detection, event isolation, time series correlation and dimension analysis.
  2. Scalable backend: The backend system executes the analyzers, providing both multi-tenant and isolated execution environments. It ensures that analyzers can be run at scale, handling thousands of automated analyses per day.
  3. Integration with workflows: DrP integrates with alerting and incident management tools, allowing for the auto-triggering of analyzers on incidents. This integration ensures that investigation results are immediately available to on-call engineers.
  4. Post-processing system: After an investigation, the post-processing system can take automated actions based on the analysis results. For example, it can create tasks or pull requests to mitigate issues identified during the investigation.

How It Works 

Authoring Workflow

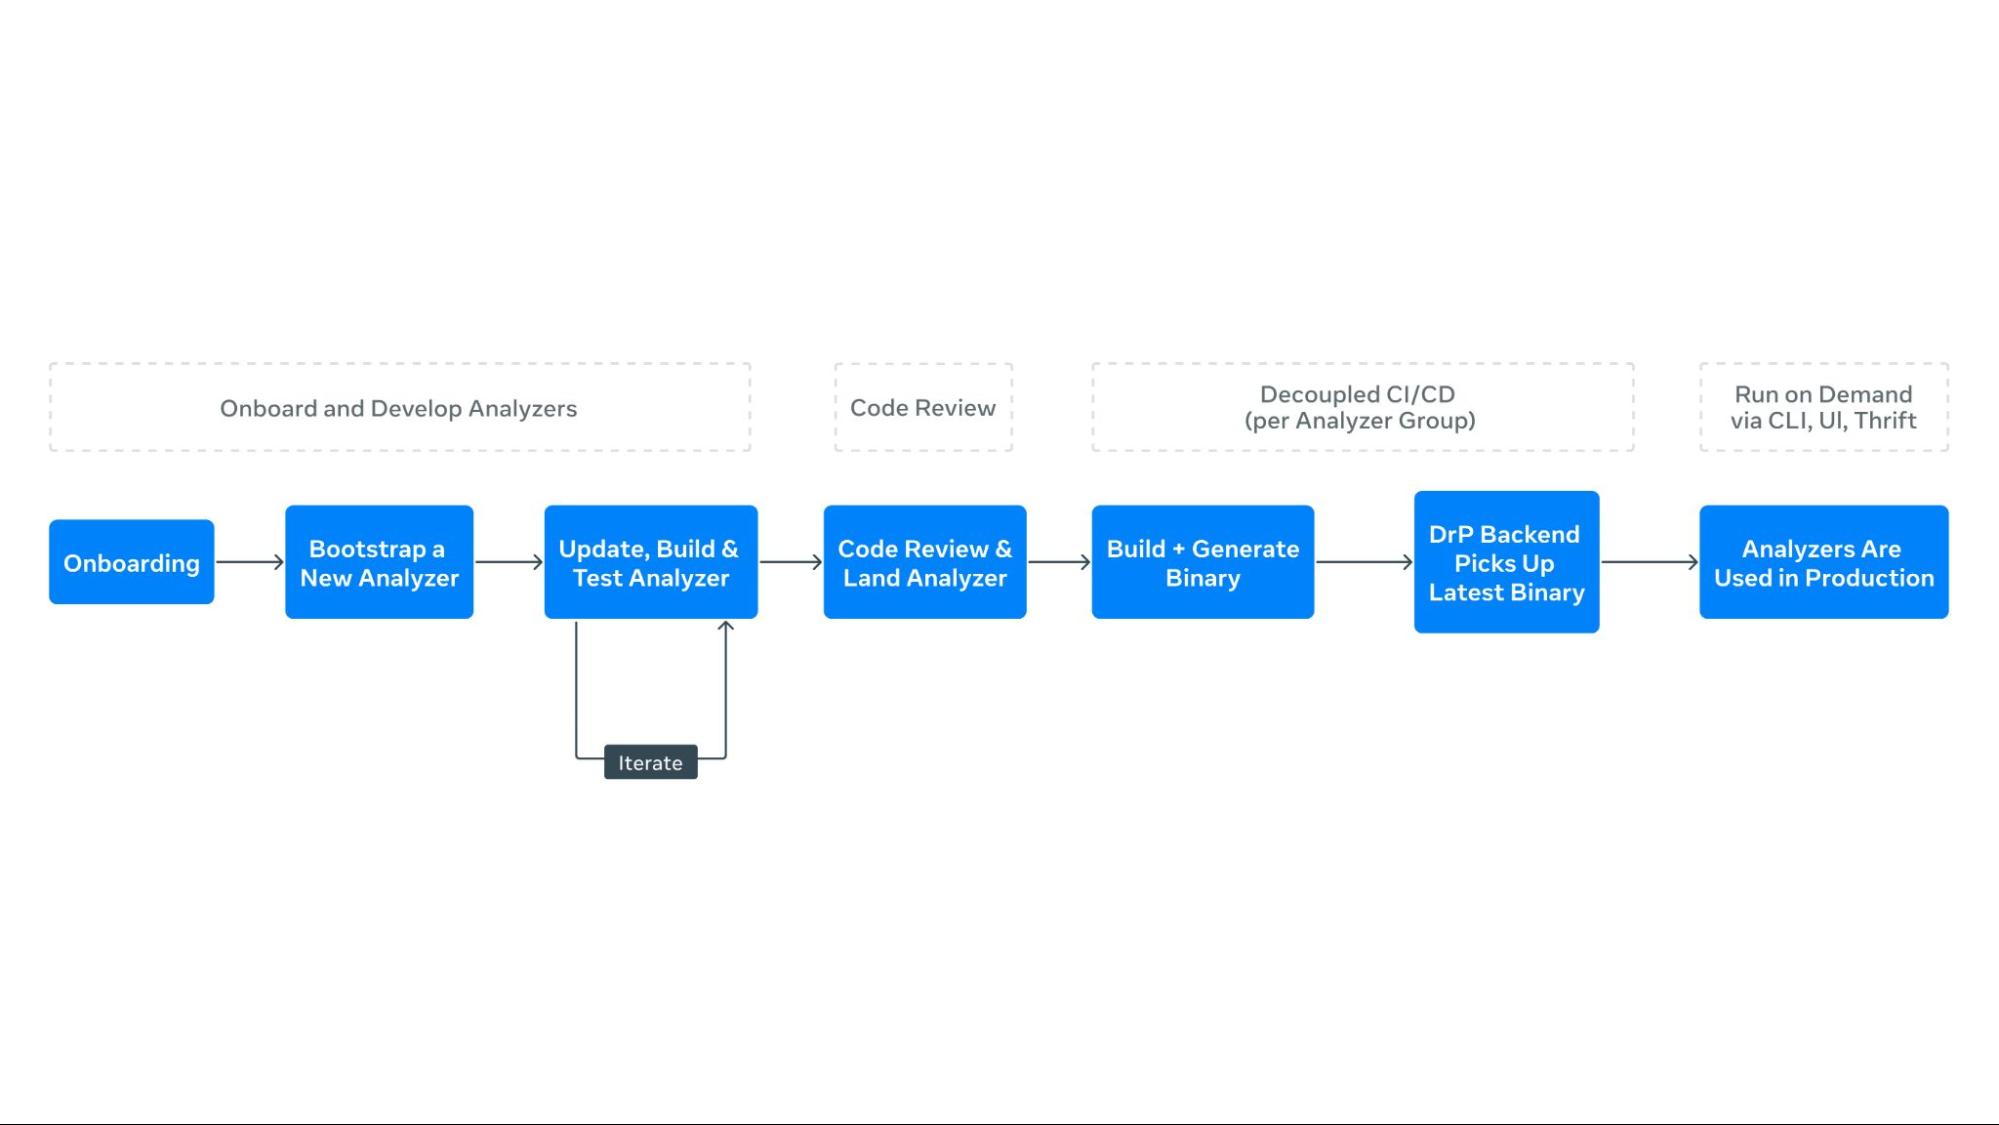
The process of creating automated playbooks, or analyzers, begins with the DrP SDK. Engineers enumerate the investigation steps, listing inputs and potential paths to isolate problem areas. The SDK provides APIs and libraries to codify these workflows, allowing engineers to capture all required input parameters and context in a type-safe manner.

  1. Enumerate investigation steps: Engineers start by listing the steps required to investigate an incident, including inputs and potential paths to isolate the problem.
  2. Bootstrap code: The DrP SDK provides bootstrap code to create a template analyzer with pre-populated boilerplate code. Engineers extend this code to capture all necessary input parameters and context.
  3. Data access and analysis: The SDK includes libraries for data access and analysis, such as dimension analysis and time series correlation. Engineers use these libraries to code the main investigation decision tree into the analyzer.
  4. Analyzer chaining: For dependent service analysis, the SDK’s APIs allow for seamless chaining of analyzers, passing context and obtaining outputs.
  5. Output and post-processing: The output method captures findings from the analysis, using special data structures for both text and machine-readable formats. Post-processing methods automate actions based on analyzer findings.

Once created, analyzers are tested and sent for code review. DrP offers automated backtesting integrated into code review tools, ensuring high-quality analyzers before deployment.

Consumption Workflow

In production, analyzers integrate with tools like UI, CLI, alerts, and incident management systems. Analyzers can automatically trigger upon alert activation, providing immediate results to on-call engineers and improving response times. The DrP backend manages a queue for requests and a worker pool for secure execution, with results returning asynchronously.

  1. Integration with alerts: DrP is integrated with alerting systems, allowing analyzers to trigger automatically when an alert is activated. This provides immediate analysis results to on-call engineers.
  2. Execution and monitoring: The backend system manages a queue for analyzer requests and a worker pool for execution. It monitors execution, ensuring that analyzers run securely and efficiently.
  3. Post-processing and insights: A separate post-processing system handles analysis results, annotating alerts with findings. The DrP Insights system periodically analyzes outputs to identify and rank top alert causes, aiding teams in prioritizing reliability improvements.

Why It Matters

Reducing MTTR

DrP has demonstrated significant improvements in reducing MTTR across various teams and use cases. By automating manual investigations, DrP enables faster triage and mitigation of incidents, leading to quicker system recovery and improved availability.

  1. Efficiency: Automated investigations reduce the time engineers spend on manual triage, allowing them to focus on more complex tasks. This efficiency translates to faster incident resolution and reduced downtime.
  2. Consistency: By codifying investigation workflows into analyzers, DrP ensures consistent and repeatable investigations. This consistency reduces the likelihood of errors and improves the reliability of incident resolution.
  3. Scalability: DrP can handle thousands of automated analyses per day, making it suitable for large-scale systems with complex dependencies. Its scalability ensures that it can support the needs of growing organizations.

Enhancing On-Call Productivity

The automation provided by DrP reduces the on-call effort during investigations, saving engineering hours and reducing on-call fatigue. By automating repetitive and time-consuming steps, DrP allows engineers to focus on more complex tasks, improving overall productivity.

Scalability and Adoption

DrP has been successfully deployed at scale at Meta, covering over 300 teams and 2000 analyzers, executing 50,000 automated analyses per day. Its integration into mainstream workflows, such as alerting systems, has facilitated widespread adoption and demonstrated its value in real-world scenarios.

  1. Widespread adoption: DrP has been adopted by hundreds of teams across various domains, demonstrating its versatility and effectiveness in addressing diverse investigation needs.
  2. Proven impact: DrP has been in production for over five years, with proven results in reducing MTTR and improving on-call productivity. Its impact is evident in the positive feedback received from users and the significant improvements in incident resolution times.
  3. Continuous improvement: DrP is continuously evolving, with ongoing enhancements to its ML algorithms, SDK, backend system, and integrations. This commitment to continuous improvement ensures that DrP remains a cutting-edge solution for incident investigations, while its growing adoption across teams enables existing workflows and analyzers to be reused by others, compounding the shared knowledge base and making it increasingly valuable across the organization.

What’s Next

Looking ahead, DrP aims to evolve into an AI-native platform, playing a central role in advancing Meta’s broader AI4Ops vision, enabling more powerful and automated investigations. This transformation will enhance analysis by delivering more accurate and insightful results, while also simplifying the user experience through streamlined ML algorithms, SDKs, UI, and integrations facilitating effortless authoring and execution of analyzers.

Read the Paper

DrP: Meta’s Efficient Investigations Platform at Scale

Acknowledgements

We wish to thank contributors to this effort across many teams throughout Meta

Team –  Eduardo Hernandez, Jimmy Wang, Akash Jothi, Kshitiz Bhattarai, Shreya Shah, Neeru Sharma, Alex He, Juan-Pablo E, Oswaldo R, Vamsi Kunchaparthi, Daniel An, Rakesh Vanga, Ankit Agarwal, Narayanan Sankaran, Vlad Tsvang, Khushbu Thakur, Srikanth Kamath, Chris Davis, Rohit JV, Ohad Yahalom, Bao Nguyen, Viraaj Navelkar, Arturo Lira, Nikolay Laptev, Sean Lee, Yulin Chen

Leadership – Sanjay Sundarajan, John Ehrhardt, Ruben Badaro, Nitin Gupta, Victoria Dudin, Benjamin Renard, Gautam Shanbhag, Barak Yagour, Aparna Ramani

The post DrP: Meta’s Root Cause Analysis Platform at Scale appeared first on Engineering at Meta.

Read the whole story
prirai
1 day ago
reply
Share this story
Delete

The new ChatGPT Images is here

1 Comment

The new ChatGPT Images is here

OpenAI shipped an update to their ChatGPT Images feature - the feature that gained them 100 million new users in a week when they first launched it back in March, but has since been eclipsed by Google's Nano Banana and then further by Nana Banana Pro in November.

The focus for the new ChatGPT Images is speed and instruction following:

It makes precise edits while keeping details intact, and generates images up to 4x faster

It's also a little cheaper: OpenAI say that the new gpt-image-1.5 API model makes image input and output "20% cheaper in GPT Image 1.5 as compared to GPT Image 1".

I tried a new test prompt against a photo I took of Natalie's ceramic stand at the farmers market a few weeks ago:

Add two kakapos inspecting the pots

Outdoor craft market booth displaying handmade ceramics and jewelry on a navy tablecloth with "NATBAT CREATIONS CALIFORNIA USA" logo. Items include colorful glazed ceramic cups in blue, orange, and black; decorative bowls including a rainbow-striped piece; jewelry pendants and earrings on wooden display stands; ceramic plant markers in various colors labeled "Artichoke", "Cilantro", "Chili", "Oregano", "Potato", "Pumpkin", "Sage".

Here's the result from the new ChatGPT Images model:

Same craft market booth as previous image, now with two large olive-green Kākāpō parrots perched on the table among the ceramics, one investigating the blue glazed cups and the other examining an orange cup.

And here's what I got from Nano Banana Pro:

Same craft market booth with two Kākāpō now in different positions: one remains center-table peering into the ceramic cups near the rainbow pot, while the second has moved to the right edge of the table near the plant markers, appearing to examine or possibly chew on items at the table's corner. They are both a little smaller than in the first image.

The ChatGPT Kākāpō are a little chonkier, which I think counts as a win.

I was a little less impressed by the result I got for an infographic from the prompt "Infographic explaining how the Datasette open source project works" followed by "Run some extensive searches and gather a bunch of relevant information and then try again" (transcript):

Infographic titled "HOW DATASETTE WORKS" with subtitle "THE OPEN SOURCE DATA PLATFORM" showing a four-step workflow. STEP 1 (orange): "LOAD YOUR DATA" - "CSV, JSON, XLSX, SQLite, PostgreSQL, etc." with icons of file types flowing into a laptop. Below: "IMPORT DATASETS - Turn your structured data into SQLite databases and .db files." with checkmarks for "Datasette Desktop App for local deployment", "CLI tool for command-line imports", "Automatic CSV import tool". STEP 2 (green): "PUBLISH & DEPLOY" - "HOST DATASETS ONLINE" with cloud and server icons labeled "DEPLOY". Below: "SHARE ONLINE - Deploy your Datasette instance to a public server." with checkmarks for "Datasette Cloud - Free hosting service", "Deploy anywhere via plugins", "Configurable API tools". STEP 3 (purple): "EXPLORE & QUERY" - "BROWSE, SEARCH & VISUALIZE" with database and browser window icons. Below: "SQL QUERIES & SEARCH - Browse, filter, search, and visualize your data with an interactive web interface." with checkmarks for "Perform SQL queries directly from the browser", "Filter, sort, and facet data", "Generate custom visualizations and charts". STEP 4 (red): "BUILD & EXTEND" - "PLUGINS, APIS & INTEGRATIONS" with gear and wrench icons labeled "API". Below: "CUSTOMIZE & DEVELOP" with bullets "Develop custom plugins for added functionality", "Access JSON API for programmatic queries", "Embed and integrate Datasette into other applications". Bottom banner shows four features: "OPEN DATA PLATFORM - Widely used for visualizing, sharing and building applications with SQLite backed data", "EXTENSIBLE PLUGINS - 100+ plugins available, inc uding chaps, charts authentication, and more", "ACCESS CONTROL - Granular permissions for controlling who s an access and interact with your data", "OPEN SOURCE PROJECT - Actively developed open source project with a vibrant community of contributors".

See my Nano Banana Pro post for comparison.

Both models are clearly now usable for text-heavy graphics though, which makes them far more useful than previous generations of this technology.

Tags: ai, kakapo, openai, generative-ai, text-to-image, nano-banana

Read the whole story
prirai
4 days ago
reply
Nano banana didn't change the original image so that's a win
Share this story
Delete

GSoC 2025, Building a Semantic Search Engine for Any Video

1 Share

Hello, openSUSE community!

My name is Akash Kumar, and I was a Google Summer of Code (GSoC) 2025 mentee with the openSUSE organization. This blog post highlights the project I developed during this mentorship program, which openSUSE and its mentors helped make possible. This summer, I had the incredible opportunity to contribute to the project titled “Create open source sample microservice workload deployments and interfaces.” The goal was to build a functional, open-source workload that could provide relevant analytics for a specific use case.

For my project, I chose to tackle a common but complex problem: searching for content inside a video. This blog post details the outcome of my GSoC project: a full, end-to-end semantic video search engine.

The Problem: Beyond Keywords

Ever tried to find a specific moment in a long video? You might remember the scene vividly - a character gives a crucial speech, or there’s a beautiful, silent shot of a landscape - but you can’t remember the exact timestamp. You end up scrubbing back and forth, wasting minutes, or even hours.

Traditional video search relies on titles, descriptions, and manual tags. It’s limited. It can’t tell you what’s inside the video.

As part of my GSoC deliverable, I set out to solve this. I wanted to build a system that lets you search through a video’s content using natural language. I wanted to be able to ask, “find the scene where they discuss the secret plan in the warehouse,” and get an instant result.

The Big Picture: A Two-Act Play

The entire system is divided into two main parts:

  1. The Ingestion Pipeline (The Heavy Lifting): An offline process that takes a raw video file and uses a suite of AI models to analyze it, understand it, and store that understanding in a specialized database.
  2. The Search Application (The Payoff): A real-time web application with a backend API and a frontend UI that lets users perform searches and interact with the results.

Let’s walk through how it all works, step by step.

Part 1: The Ingestion Pipeline - Teaching the Machine to Watch TV

This is where the magic begins. We take a single .mp4 file and deconstruct it into a rich, multi-modal dataset.

Step 1: Deconstructing the Video (Extraction)

First, we break the video down into its fundamental atoms: shots, sounds, and words. I used a series of specialized AI models for this:

  • Shot Detection (TransNetV2): The video is scanned to identify every single camera cut, creating a “skeleton” of the video’s structure.
  • Transcription & Diarization (WhisperX): The audio is extracted, and WhisperX transcribes all spoken dialogue into text. Crucially, it also performs diarization—identifying who spoke and when, assigning generic labels like SPEAKER_00 and SPEAKER_01.
  • Visual Captioning (BLIP): For every single shot, we extract a keyframe and ask the BLIP model to generate a one-sentence description of what it sees (e.g., “a man in a suit is standing in front of a car”).
  • Action & Audio Recognition (VideoMAE, AST): We go even deeper, analyzing the video clips to detect actions (“talking,” “running”) and the audio to identify non-speech events (“music,” “applause,” “engine sounds”).

At the end of this step, we have a mountain of raw, timestamped data.

Step 1.5: The Human in the Loop (Speaker ID)

The AI knows that different people are speaking, but it doesn’t know their names. This is where a little human intelligence goes a long way. The pipeline automatically pauses and launches a simple web tool. In this tool, I can see all the dialogue for SPEAKER_00, play a few clips to hear their voice, and map them to their real name, like “John Wick.” This simple, one-time step makes the final data infinitely more useful.

Step 2: Finding the Narrative (Intelligent Segmentation)

Searching through hundreds of tiny, 2-second shots isn’t a great user experience. We need to group related shots into coherent scenes or segments. A single conversation might involve 20 shots, but it’s one single event.

To solve this, I developed a “Boundary Scoring” algorithm. It iterates through every shot and calculates a “change score” to the next one, based on a weighted combination of factors:

  • Has the topic of conversation changed? (semantic text similarity)
  • Have the visuals changed significantly?
  • Did the person speaking change?
  • Did the background sounds or actions change?

If the total change score is high, we declare a “hard boundary” and start a new segment. This transforms a chaotic list of shots into a clean list of meaningful scenes.

Step 3: Adding a Layer of Genius (LLM Enrichment)

With our coherent segments defined, we bring in a Large Language Model (like Google’s Gemini) to act as an expert video analyst. For each segment, we feed the LLM all the context we’ve gathered—the transcript, the speakers, the visual descriptions, the actions—and ask it to generate:

  1. A short, descriptive Title.
  2. A concise 2-3 sentence Summary.
  3. A list of 5-7 relevant Keywords.

This adds a layer of human-like understanding, making the data even richer and more searchable.

Step 4: Preparing for Search (Indexing)

The final step is to prepare this data for lightning-fast search. We use a vector database (ChromaDB). The core idea is to convert text into numerical representations called embeddings.

The key innovation here is our hybrid embedding strategy. For each segment, we create two distinct embeddings:

  • Text Embedding: Based on the transcript and summary. This represents what was said.
  • Visual Embedding: Based on the visual captions and actions. This represents what was shown.

These embeddings are stored in ChromaDB. Now, the video is fully processed and ready to be searched.

Part 2: The Search Application - Reaping the Rewards

This is where all the offline work pays off. The application consists of a backend “brain” and a frontend “face.”

The Brains: The FastAPI Backend

The backend API is the engine of our search. When it receives a query, it follows a precise, high-speed process:

  1. Vectorize Query: The user’s query is converted into the same type of numerical vector using the same model from the indexing step.
  2. Hybrid Search: It queries ChromaDB twice in parallel—once against the text embeddings and once against the visual embeddings.
  3. Re-Rank & Fuse: It takes both sets of results and merges them using an algorithm called Reciprocal Rank Fusion (RRF). This is incredibly powerful. A segment that ranks highly on both the text and visual search (e.g., a character says “Look at the helicopter” while a helicopter is on screen) gets a massive score boost and shoots to the top of the list.
  4. Respond: The backend fetches the full metadata for the top-ranked results and sends it back to the frontend as a clean JSON response.

The Face: The Streamlit UI

The frontend is a simple, clean web interface built with Streamlit. It features a search bar, a video player, and a results area. When you click “Play” on a search result, it instantly jumps the video player to the exact start time of that segment. It’s fast, intuitive, and incredibly satisfying to use.

The Final Result & GSoC Experience

Imagine searching for “a tense negotiation in a warehouse.” The system finds it in seconds because:

  • The Text Search matches the dialogue about “the deal,” “the money,” and “the terms.”
  • The Visual Search matches the AI captions like “two men sitting at a table” and “a dimly lit, large room.”
  • The RRF algorithm sees that both signals point to the same segment and ranks it as the #1 result.

This project was a fascinating journey into the world of multi-modal AI. It demonstrates that by combining the strengths of different models, we can deconstruct unstructured data like video and reassemble it into a smart, searchable, and genuinely useful asset.

I want to extend a huge thank you to my mentor, @bwgartner, and the entire openSUSE community for their support and guidance throughout the summer. Participating in GSoC with openSUSE has been an invaluable learning experience.

The days of aimless scrubbing may soon be behind us. If you’re interested in trying it out or contributing, you can find the entire project on GitHub: https://github.com/AkashKumar7902/video-seach-engine.


Read the whole story
prirai
74 days ago
reply
Share this story
Delete

FAQ About Being Ghosted After Your Final Interview

1 Share

Q: I haven’t heard anything since my final interview. Who should I contact?

A: Damn, that’s crazy. Wow.

Q: How long will it take to hear back?

A: It will take some time. (If you’re successful.)

Q: And what if I’m unsuccessful?

A: You will know if you’re unsuccessful.

Q: How?

A: You won’t be working here.

Q: Well, yes, but won’t you be telling me that I didn’t get the job?

A: Why would we do that?

Q: Wait. Have I been ghosted?

A: We prefer the term “unworthy of closure.”

Q: What? Why have I been ghosted?

A: It could be that you’re arrogant. It could be that you’re humble. It could be that you’re too boisterous or too quiet. It could be you didn’t ask enough questions or you asked too many. It could be because you brought up working from home too soon. Or too late. It could be your overall personality and dislikability. It could be because you’re obviously pregnant. Ultimately, it’s because you don’t deserve this job, skills-wise or as a human being.

Q: Was there anything I could’ve done?

A: No. But also yes.

Q: That’s confusing. Could you please explain?

A: You could’ve been an overall better and more deserving person, although not too much better.

Q: That doesn’t help with my confusion. What do you mean “not too much better”?

A: If you met all the requirements, were totally qualified for the role, and would be a top performer almost immediately, you’d threaten the hiring manager’s ego. Try to have a bit of compassion, would you? (This might be why you’re not getting the job.)

Q: Was it something to do with my salary expectations?

A: We don’t usually offer employment to people who require a market-rate salary.

Q: I just… isn’t it common human decency to let someone know if they got the job or not? I spent a lot of time and effort in this process; haven’t I got the right to some sort of closure?

A: A company doesn’t ghost you and then expect you to show up and do the job, do they? They ghost you because you didn’t get the job. (Again, because you’re undeserving.) That should be closure enough.

Q: I can’t help but think it’s a bit rude. What about feedback on improving for any future interviews?

A: We gave you clear feedback: Be (a [little] bit) better (but not too much).

Q: That’s very nonspecific. Isn’t there anything at all you could help me with?

A: [Candidate is becoming needy. Classic anxious-attachment style. Not a culture fit.]

Q: Hello?

A:

Read the whole story
prirai
314 days ago
reply
Share this story
Delete

Random Thoughts on AI (Human Generated)

1 Share

 (I wrote this post without any AI help. OH- maybe not- I used spellcheck. Does that count? Lance claims he proofread it and found some typos to correct without any AI help.)

Random Thought on AI

I saw a great talk on AI recently by Bill Regli, who works in the field. 

Announcement of the talk: here

Video of the talk:  here

-----------------------------------------------
1) One item Bill R mentioned ws that AI requires lots of Energy so
3-mile Island is being reopened. See here.

Later I recalled the song

        The Girl from 3-Mile Island

to the tune of

        The Girl from Ipanema.

The song is in my audio tape collection but that is not useful so I looked for it on the web. The copy on YouTube doesn't work; however, this website of songs about 3-mile island here included it.

In the 1990's I was in charge of the Dept Holiday Entertainment since I have an immense knowledge of, and collection of, novelty songs- many in CS and Math.

Today- My talents are no longer needed as anyone can Google Search and find stuff. I did a blog on that here. I still have SOME advantage since I know what's out there, but not as much. Indeed, AI can even write and sing songs. I blogged about that and pointed to one such song here.

SO, some people's talents and knowledge are becoming obsolete.  On the level of novelty songs I am actually HAPPY that things change- I can access so much stuff I could not before. But humans becoming obsolete is a serious issue of employment and self worth. Far more serious then MACHINES TAKE OVER THE WORLD scenarios.

---------------------------------------------------------
2) When technology made farming jobs go away, manufacturing jobs took their place. That was true in the LONG run, but in the SHORT run there were starving ex-farmers. The same may happen now.

(ADDED LATER; someone emailed me that Machines taking over farming and other things has caused standards of living to go up. YES, I agree- in the LONG run very good, but in the short run people did lose their livelihoods.)

Truck Drivers and Nurses may do better than Accountants and Lawyers:

Self Driving trucks are 10 years away and always will be.
Nurses need to have a bedside manner that AI doesn't (for now?).

One ADVANTAGE of AI is that if it makes white collar workers lose jobs the government might get serious about

Guaranteed Basic Income, and

Univ. Health care

(ADDED LATER: someone emailed me that there GBI is not the way to go. Okay, then I should rephase as when white collar workers lose their jobs then the problem of a social saftey net will suddently become important.) 

Similar: If global warming makes the Cayman Island sink then suddenly Global Warming will be an important problem to solve.

------------------------------------------------
3) An example of AI taking away jobs is the Writers Strike.

OLD WAY: There were 10 people writing Murder She Wrote Scripts.

NEW WAY: AN AI generates a first draft and only needs 2 people to polish it.

KEY: In a murder mystery the guilty person is an innocuous character you saw in the first 10 minutes or a celebrity guest star. Sometimes the innocuous character is the celebrity guest star.

-------------------------------------------------
4) ChatGPT and school and cheating.

Calculator Scenario: We will allow students to use Chat GPT as we now allow calculators. Students are not as good at arithmetic, but we don't care.  Is Chat GPT similar?

Losing battle scenario: Ban Chat GPT

My solution which works--- for now: Ask questions that Chat GPT is not good at, allow chat GPT, insist the students understand their own work, and admit they used it. Works well in Grad courses and even senior courses. Might be hard in a Freshman courses.

Lance's Solution--- Stop giving out grades. See here

----------------------------------------------
5) Bill R said that we will always need humans who are better at judgment.

Maybe a computer has better judgment. I blogged on this here

 --------------------------------------------------
6) I asked two AI people at lunch if the AI revolution is just because of faster computers and hence is somewhat limited. They both said YES.

SO- could it be that we are worrying about nothing?

This also may be an issue with academia: if we hire lots of AI people because it's a hot area, it may cool off soon. Actually I thought the same thing about Quantum Computing, but I was wrong there.

----------------------------------------------
7) LLM's use LOTS of energy. If you get to ask one How do we solve global warming? they might say

First step: Turn me off!

----------------------------------------------
8) Scott did a great  blog post about the ways AI could go. See here.

--------------------------------
9) I recently emailed Lance a math question.

He emailed me the answer 5 minutes later.

I emailed that I was impressed

He emailed that he just asked  Chat GPT. He had not meant to fool me, he just assumed I would assume that. Like if you asked me what 13498*11991 was and I answered quickly you would assume I used a calculator. And if there is a complicated word in this post that is spelled correctly then you would assume I used spellcheck - and there is no embarrassment in that.

--------------------------------
10) If a painting is done with AI does any human get credit for it?

I always thought that people who forge paintings that look JUST LIKE (say) a van Gogh should be able to be honest about what they do and get good money since it LOOKS like a van Gogh who cares that it is NOT a van Gogh.  Same with AI- we should not care that a human was not involved.

IF an AI finds a cure for cancer, Great!

If an AI can write a TV series better than the human writers, Great!

--------------------------------------------------------
11) AI will force us to make moral choices. Here is a horrifying scenario:

Alice buys a self-driving car and is given some options, essentially the trolley problem:

If your car has to choose who to run over, what do you choose?

You have the option of picking by race, gender, age, who is better dressed, anything you want.

-------------------------------------------------------
12) Climate Change has become a political problem in that

Democrats think it IS a problem
Rep think it is NOT a problem

Which is a shame since free-market solutions that would normally appeal to Reps are not being done (e.g., a Carbon Tax). Indeed, we are doing the opposite- some states impose a tax on Hybrid cars


SO- how will AI go with politics? Scenarios

a) Dems are for regulation, Reps are against it. Elon Musk worries about AI and he is a powerful Rep so this might not happen.  Then again, he supports Reps, many of whom have BANNED E-cars in their states

b) AI-doomsayers want more regulation, AI-awesomers do not, and this cuts across party lines.

c) We will ignore the issue until it's too late.

If I was a betting man ...

----------------------------------------------------------
13) International cooperation on being careful with AI. Good luck with that.

My cynical view: International Treaties only work when there is nothing at stake

The Chem Weapons ban works because they are hard to use anyway.

The treaty on exploring Antarctica was working until people found stuff there they wanted. It is now falling apart

Read the whole story
prirai
342 days ago
reply
Share this story
Delete

It’s Harvard time, baby: “Kerfuffle” is what you call it when you completely botched your data but you don’t want to change your conclusions.

1 Share

For it’s Harvard this, an’ Harvard that, an’ “Give the debt the boot!”
But it’s “Academic kerfuffle,” when the guns begin to shoot.

— Rudyard Kipling, American Economic Review, May, 1890.

Remember the “Excel error”? This was the econ paper from 2010 by Reinhart and Rogoff, where it turned out they completely garbled their analysis by accidentally shifting a column in their Excel table, and then it took years for it to all come out? And this was no silly Psychological Science / PPNAS bit of NPR and Gladwell bait; it was a serious article with policy relevance.

At the time this story blew up, I had some sympathy for Reinhart and Rogoff. Nobody suggested that they’d garbled their data on purpose. Even aside from that, the data analysis does not seem to have been so great (see here for some discussion), but lots of social scientists are not so great with statistics, and even if you disagree with Reinhart and Rogoff’s policy recommendations, you have to give them credit for attacking a live research problem. In this post from 2013, I criticized Reinhart and Rogoff for not admitting they’d messed up (“I recommend they start by admitting their error and then going on from there. I think they should also thank Herndon, Ash, and Pollin for finding multiple errors in their paper. Admit it and move forward.”), while at the same time recognizing that researchers are not trained to admit error. I was disappointed with the behavior of the authors of that paper after they were confronted with their errors, but I was not surprised or very annoyed.

But then I read this post by Gary Smith and now I am kinda mad. Smith writes:

In 2010, two Harvard professors, Carmen Reinhart and Ken Rogoff, published a paper in the American Economic Review, one of the world’s most-respected economics journals, arguing that when the ratio of a nation’s federal debt to its GDP rises above a 90% tipping point, the nation is likely to slide into an economic recession. . . .

Reinhart/Rogoff had made a spreadsheet error that omitted five countries (Australia, Austria, Belgium, Canada, and Denmark). Three of these countries had experienced debt/GDP ratios above 90% and all three had positive growth rates during those years. In addition, some data for Australia (1946–50), Canada (1946–50), and New Zealand (1946–49) are available, but were inexplicably not included in the Reinhart/Rogoff calculations.

The New Zealand omission was particularly important because these were four of the five years when New Zealand’s debt/GDP ratio was above 90%. Looking at all five years, the average GDP growth rate was 2.6%. With four of the five years excluded, New Zealand’s growth rate during the remaining high-debt year was a calamitous -7.6%.

There was also unusual averaging. . . . The bottom line is that Reinhart and Rogoff reported that the overall average GDP growth rate in high-debt years was a recessionary -0.1% but if we fix the above problems, the average is 2.2%.

That part of the story I’d heard before. But then there was this:

In a 2013 New York Times opinion piece, Reinhart and Rogoff dismissed the criticism of their study as “academic kerfuffle.”

C’mon. You are two Harvard professors; you published an article in an academic journal, leveraged the reputation of academic economics to make policy recommendations to the U.S. congress, and then you talk about “academic kerfuffle”! If you don’t want “academic kerfuffle,” maybe you should just write op-eds, maybe start a radio call-in show, etc.

It’s Harvard this, an’ Harvard that, when all is going well. But then when some pesky students and faculty at faculty at the University of Massachusetts check your data and find that you screwed everything up, then it’s academic kerfuffle!

UMass, can you imagine? The nerve of those people!

So, yeah, now I’m annoyed at Reinhart and Rogoff. If you don’t like academic kerfuffle, get out of goddam academia already. For a pair of decorated Harvard professors to dismiss serious criticism as “kerfuffle”—that’s a disgrace. It was a disgrace in 2013 and it remains a disgrace until they apologize for this anti-scientific, anti-scholarly attitude.

P.S. Just for some perspective on the way that work had been hyped, here’s a NYT puff piece on Reinhart and Rogoff from 2010:

Like a pair of financial sleuths, Ms. Reinhart and her collaborator from Harvard, Kenneth S. Rogoff, have spent years investigating wreckage scattered across documents from nearly a millennium of economic crises and collapses. They have wandered the basements of rare-book libraries, riffled through monks’ yellowed journals and begged central banks worldwide for centuries-old debt records. And they have manually entered their findings, digit by digit, into one of the biggest spreadsheets you’ve ever seen.

OK, you can’t fault the Times for a puff that appeared nearly three years before the error was reported. Still, it’s kinda funny that, of all things, they were praising those researchers for . . . their spreadsheet!

Read the whole story
prirai
358 days ago
reply
Share this story
Delete
Next Page of Stories